

K-VALUE meticulously maps the usage of your applications, providing business teams with the necessary insights to take corrective actions. This proactive approach aims to enhance the user experience. To optimize the digital adoption of your applications, K-VALUE suggests avenues such as supplementing training, enriching K-NOW guides, adjusting application settings, or revising business processes
K-VALUE, the Analytics Platform, offers real-time measurement of your business applications’ usage. This approach not only reduces churn but actively enhances the user experience. With K-VALUE, transform data into strategic actions for a successful digital transformation.
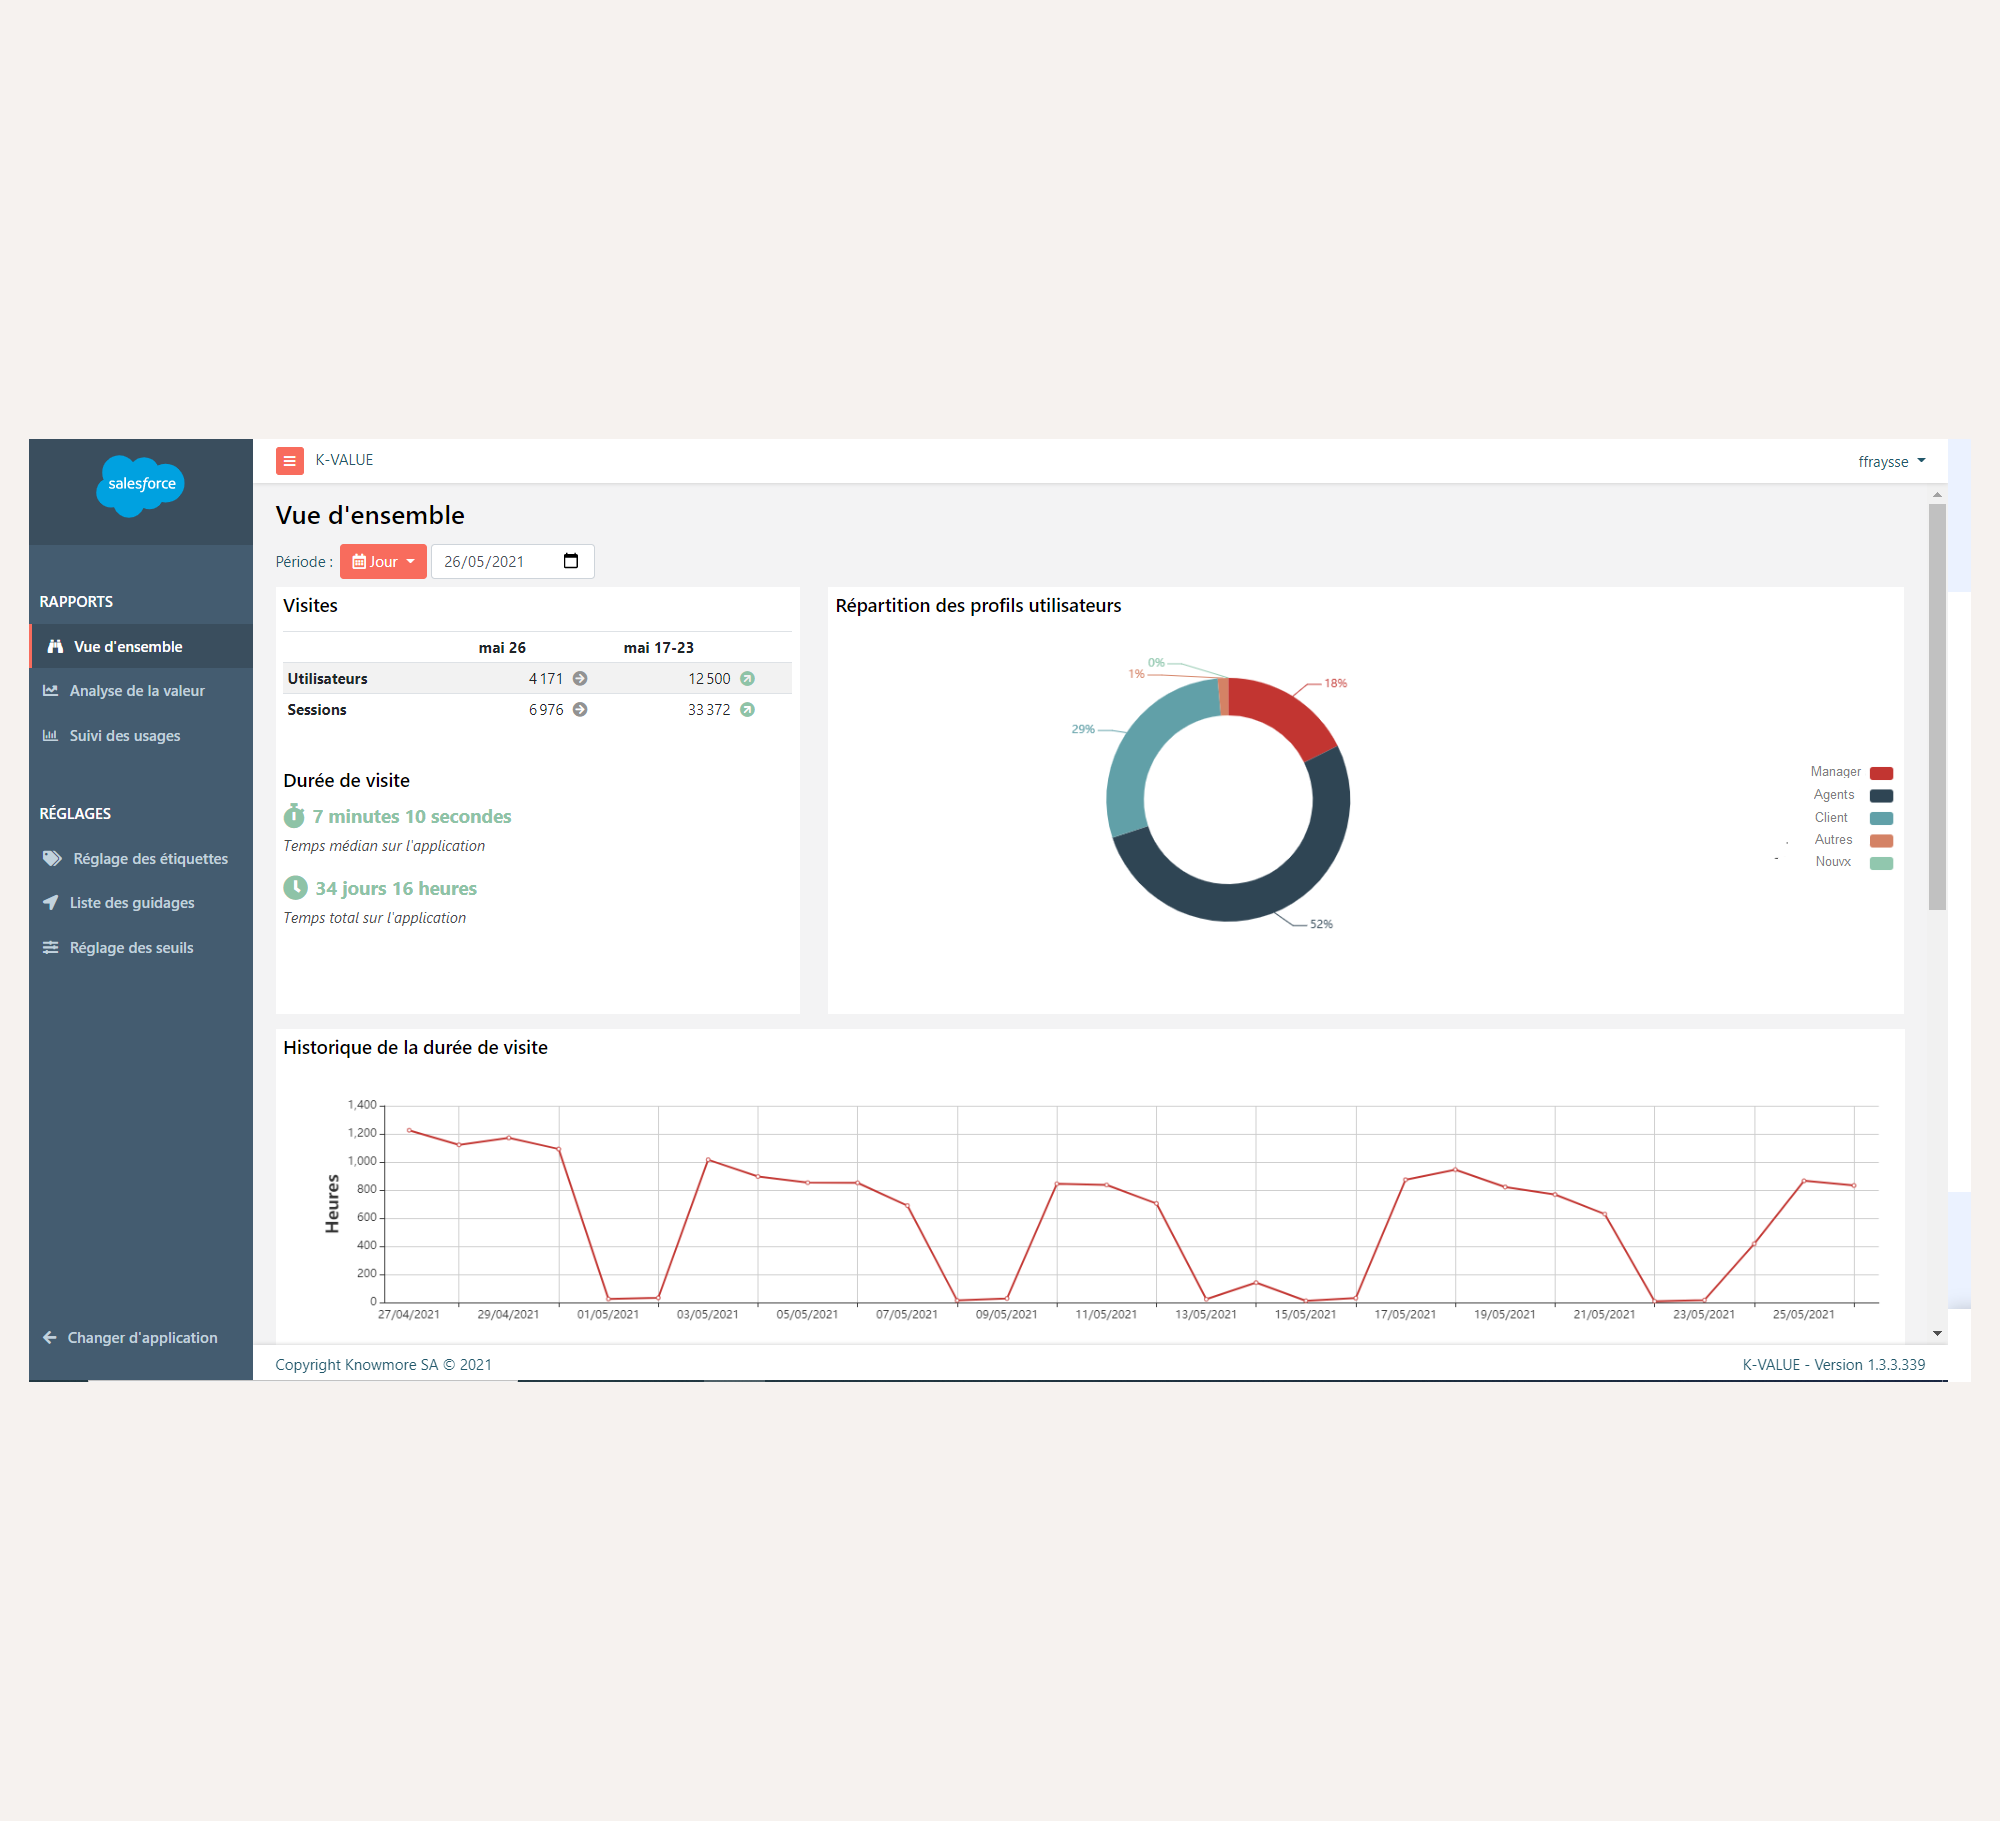
Effortlessly integrate K-VALUE into your existing application ecosystem for seamless analytics. Gain valuable insights into user interactions, application usage patterns, and performance metrics. With K-VALUE, transform raw data into actionable intelligence, enabling informed decision-making for a successful digital transformation.
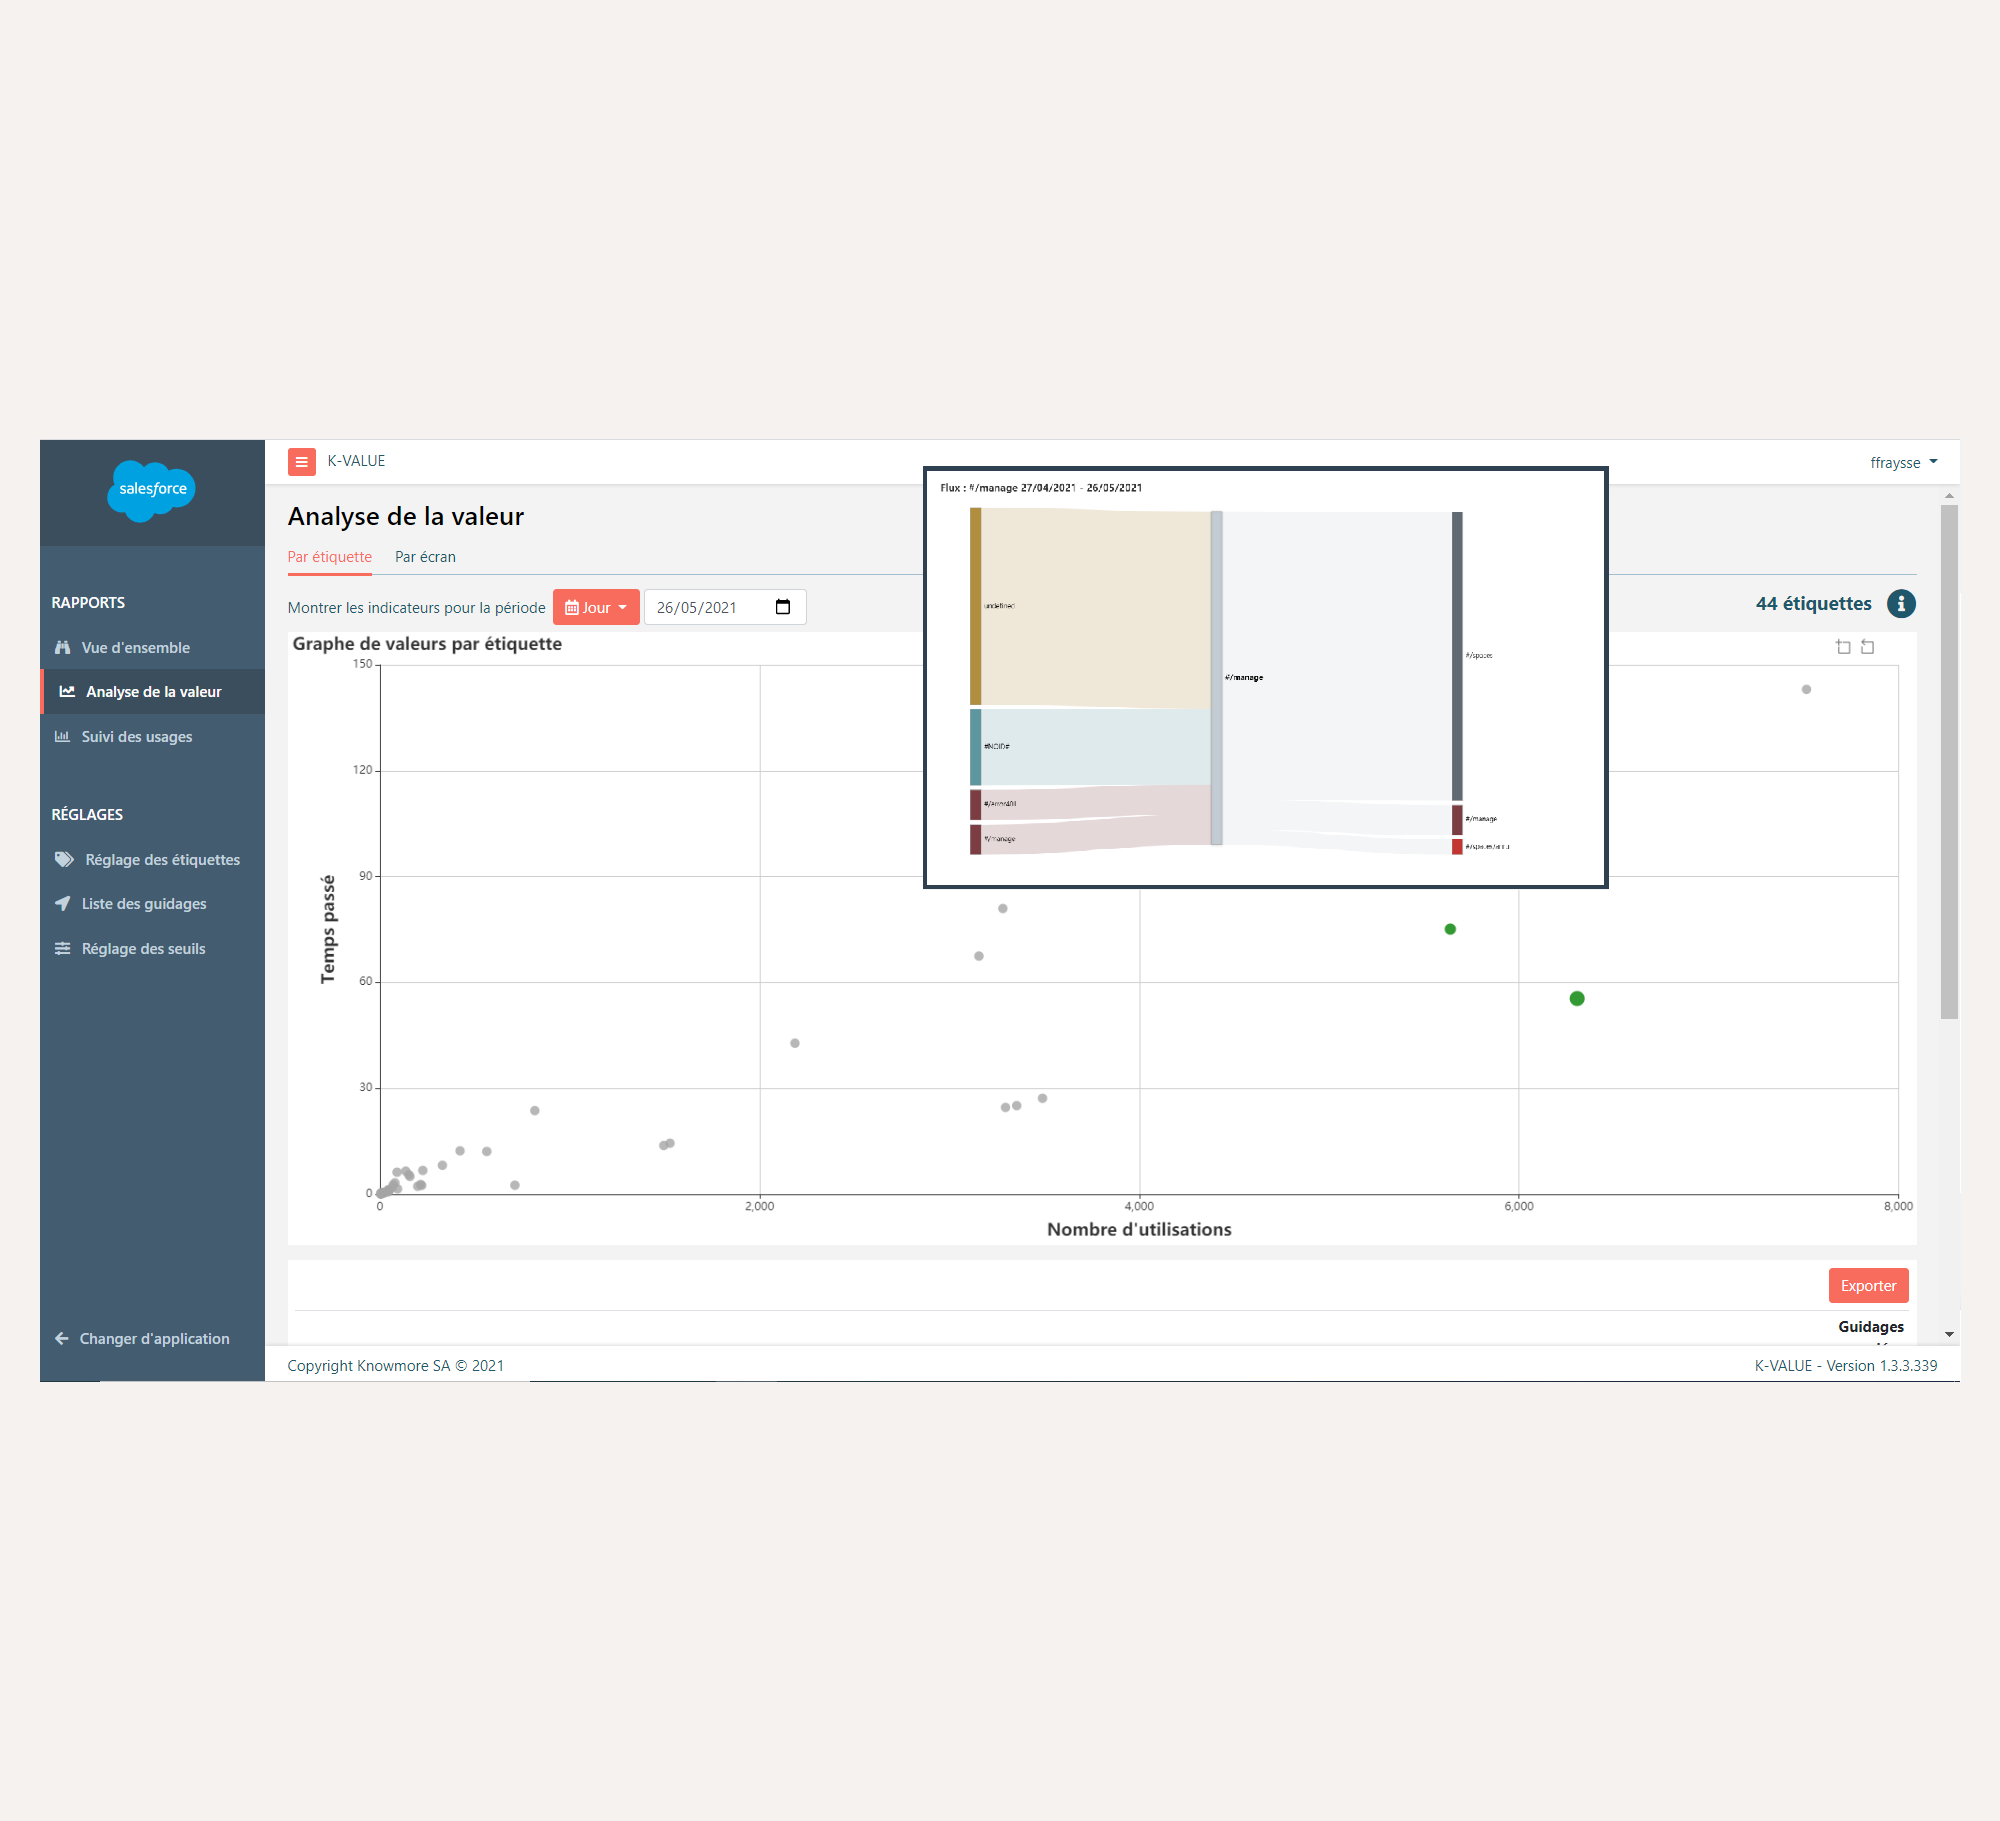
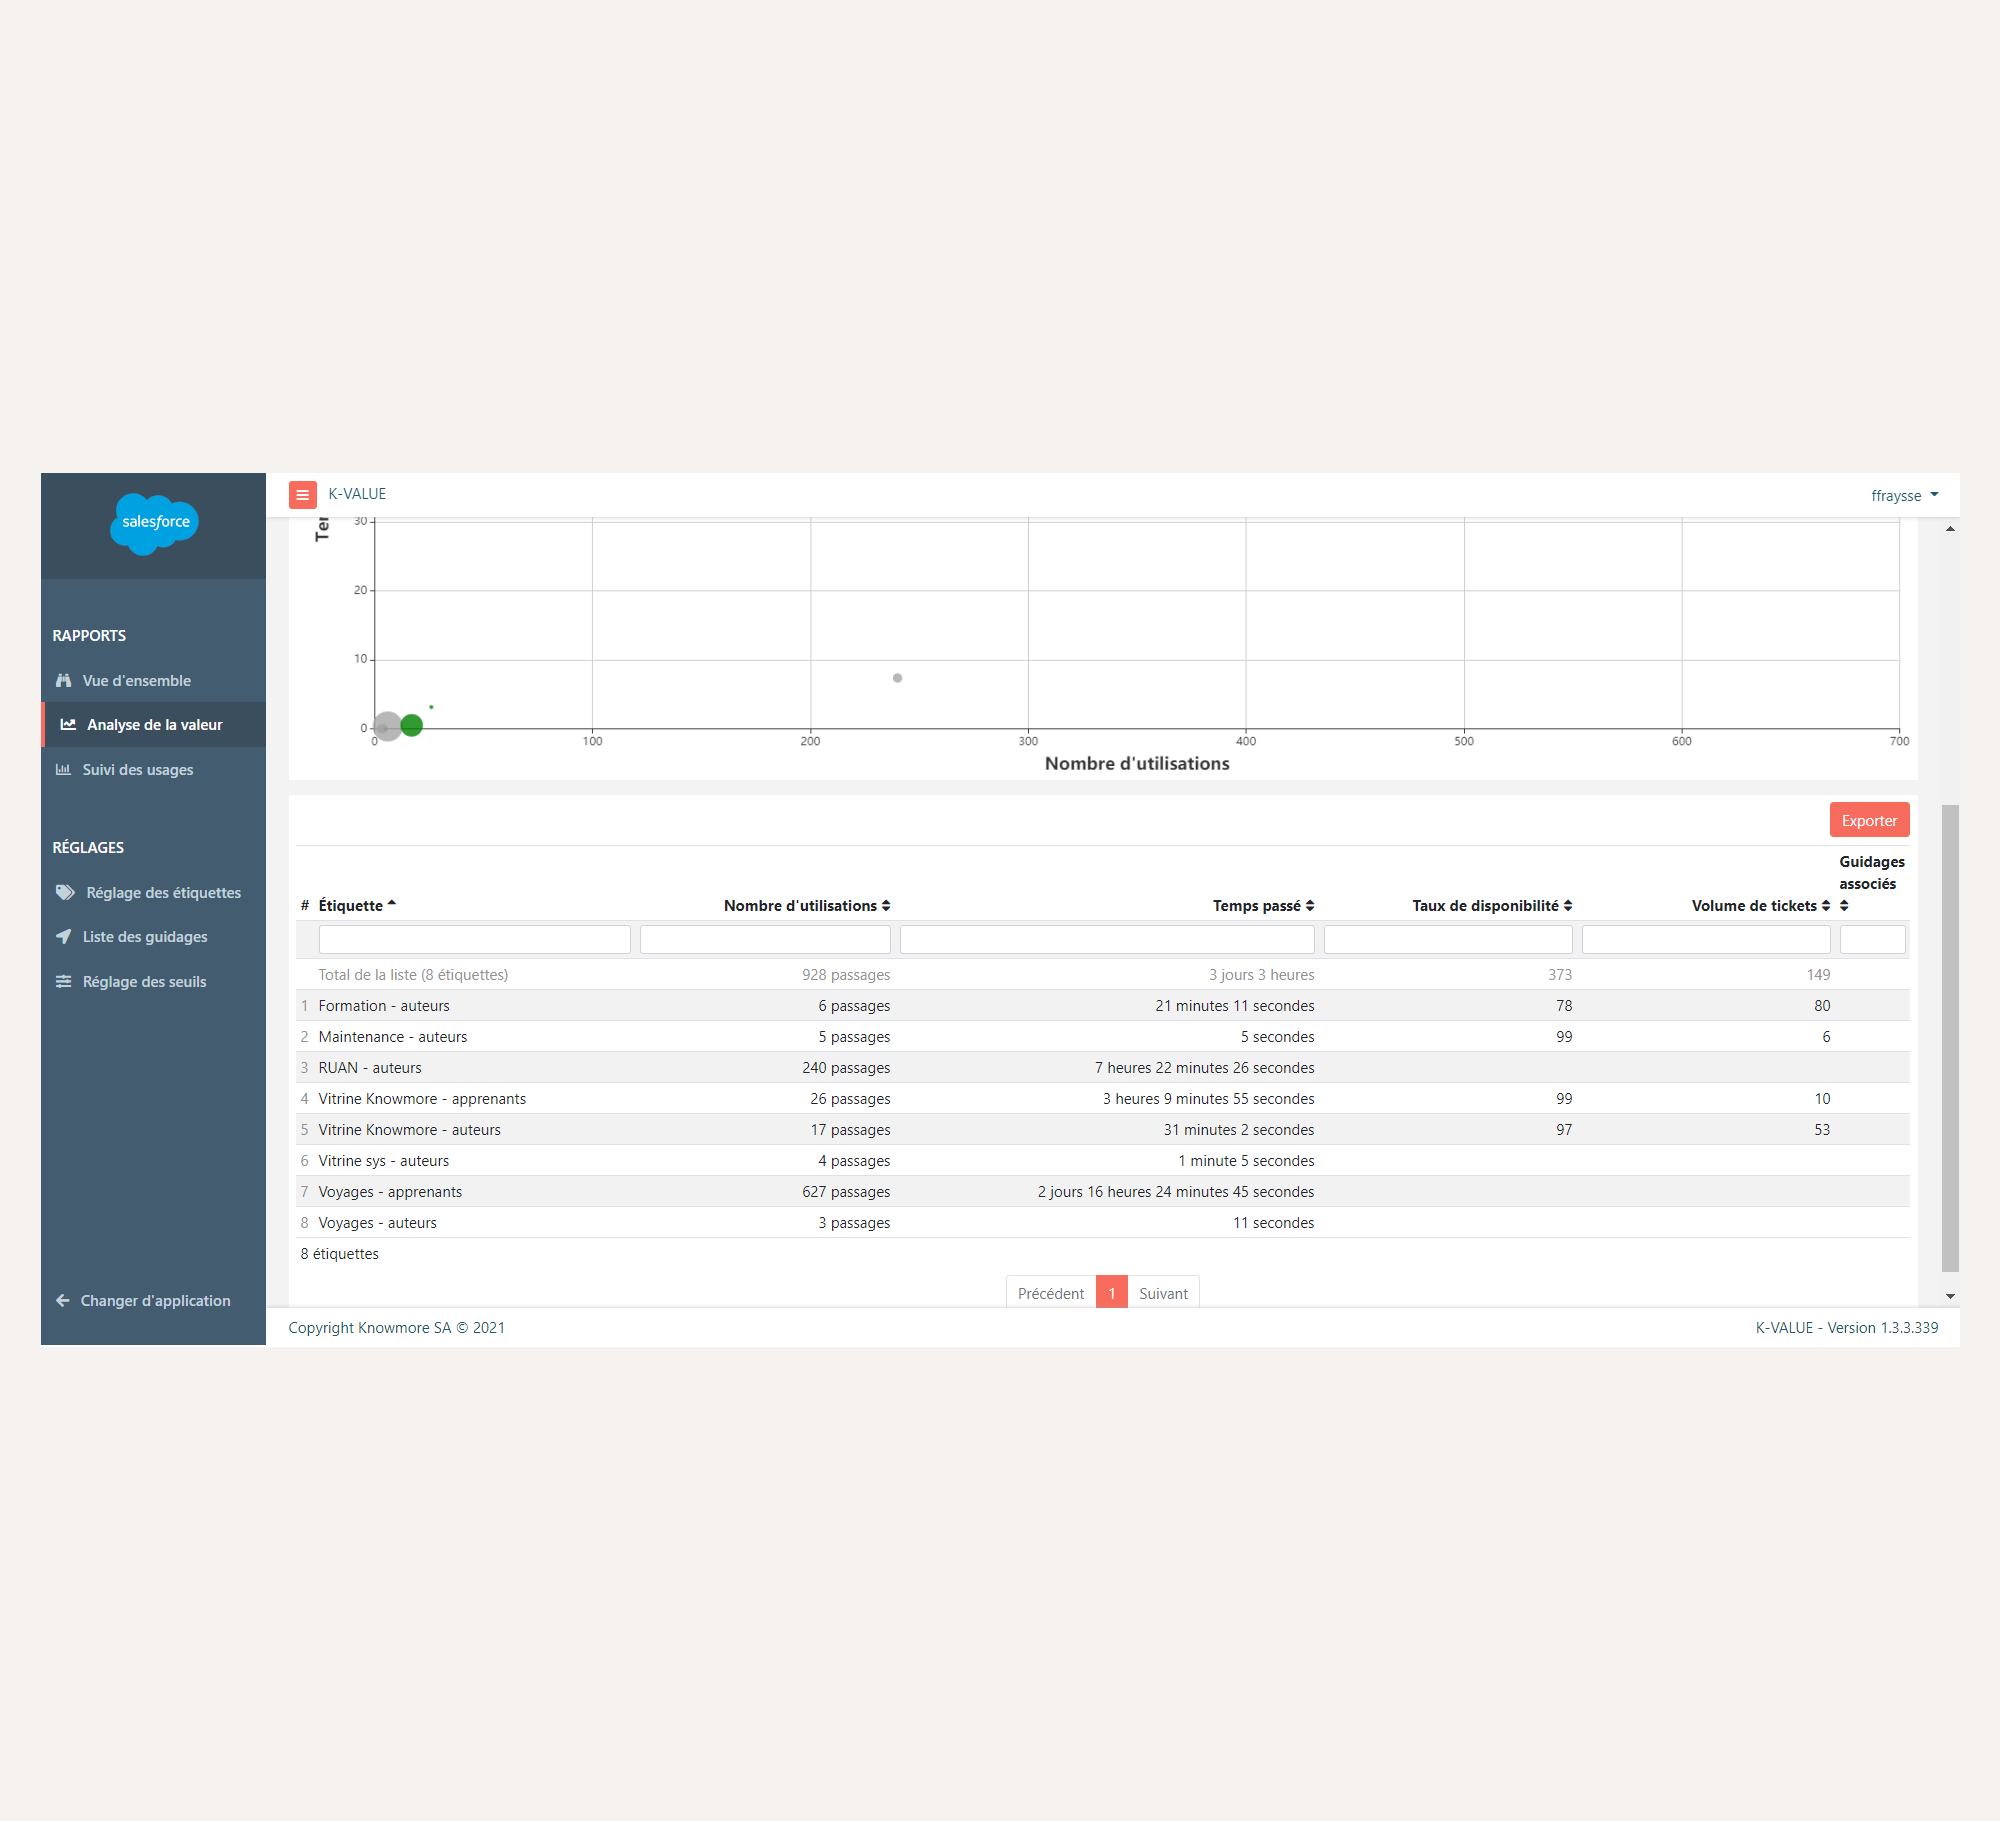
The Points Value Analysis graph simplifies data interpretation. Customizable thresholds highlight abnormal values, providing business teams with indicators before and after the deployment of a new Information System or version. This approach enables them to implement personalized strategies to enhance the user experience, aligned with their performance objectives
K-VALUE streamlines the integration of analyses by consolidating data from various databases. Easily import a CSV file from the Help Desk to enhance assessments and measure the impact of implemented actions. Users have the flexibility to configure the data mapping table, ensuring an adaptable process.
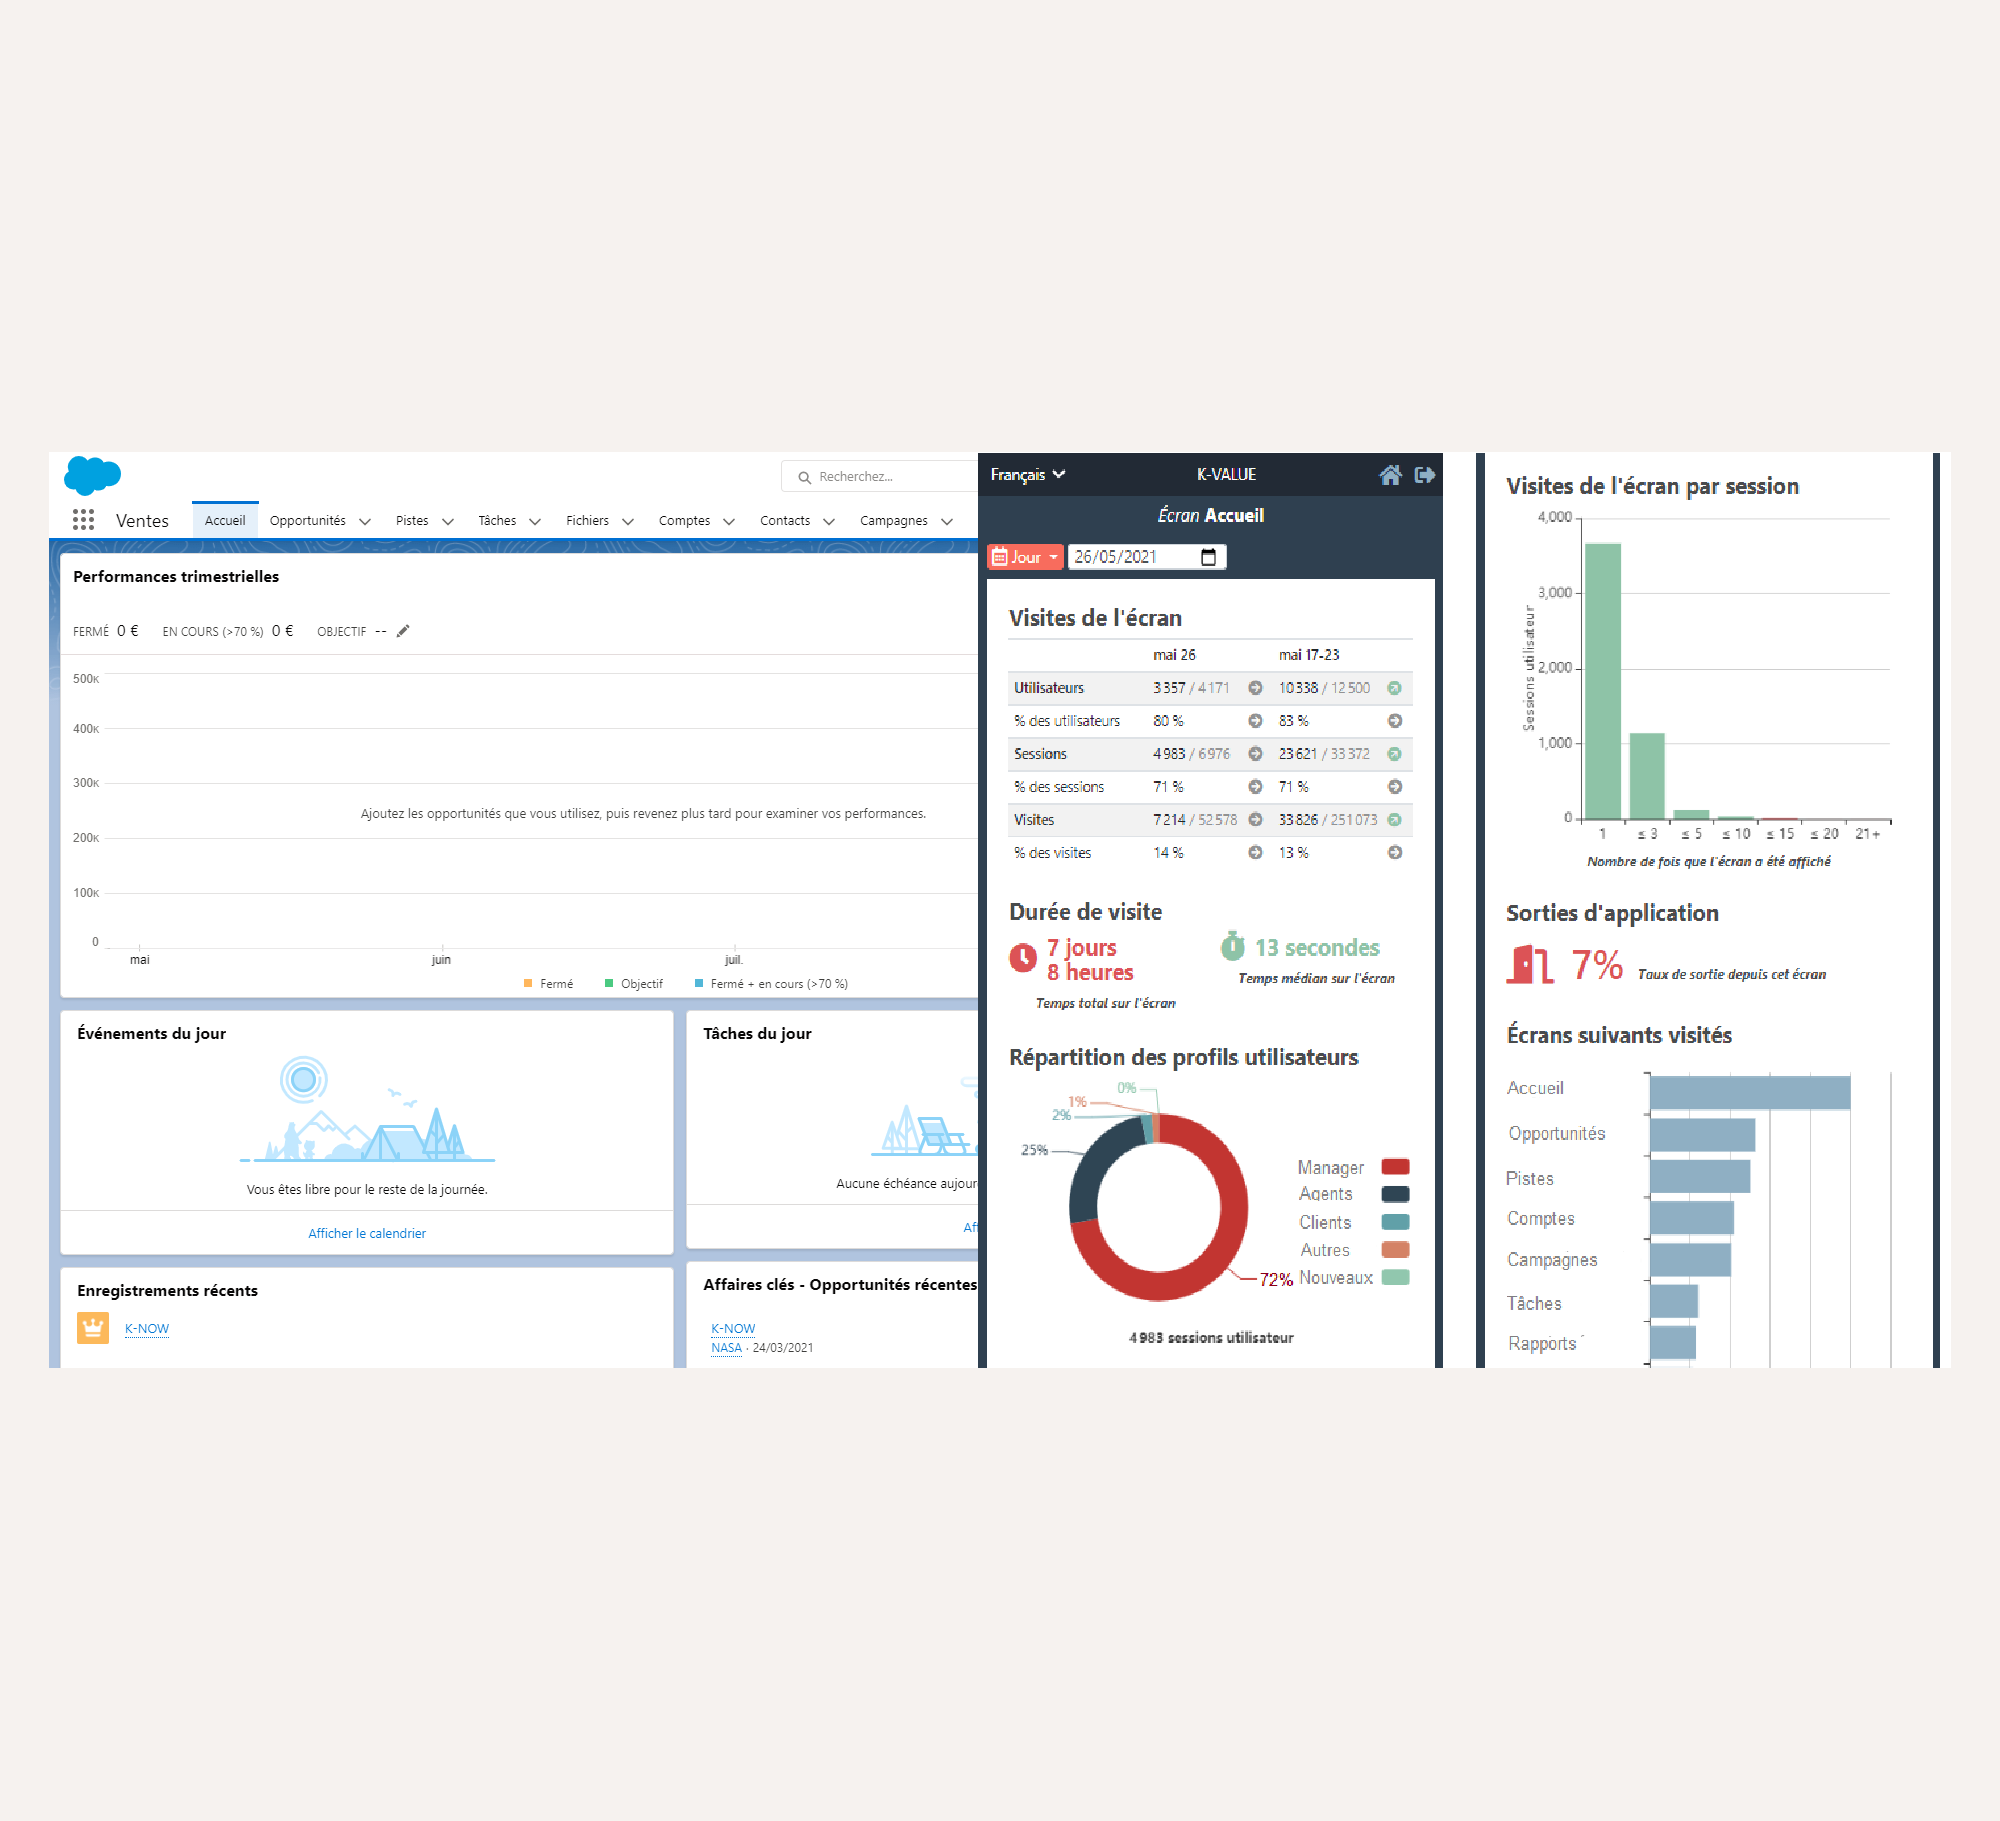
K-VALUE stands out by delivering a detailed, page-by-page analysis seamlessly integrated with the application. This functionality enables users to visualize specific results for each page and track them effortlessly throughout navigation. By presenting the analysis within the application context, interpretation becomes intuitive. Access the comprehensive summary with just a click at any moment

K-VALUE ensures a clear and visual representation of all data, facilitating easy interpretation. The interface avoids overwhelming users with a plethora of detailed information, highlighting the essentials at a glance.

K-VALUE is specifically designed to handle the massive collection of usage data on high-traffic applications. With its data processing on D+1, the platform stands out for its responsiveness, ensuring a quick delivery of data and instant display of dashboards and key indicators.

The collection and presentation of Usage Analysis are generic regardless of the application. The data can be compared and consolidated for a comprehensive multi-application analysis. The IT department can implement the usage platform for any type of application, independently of a change management project.

Are your users comfortable using your applications and web portals? What features are actually being used? Discover the ranking of the most and least used processes with K-VALUE, for targeted optimization of the user experience and maximum efficiency of your applications.

Before implementing a new information system or an updated version, K-VALUE evaluates the usage of an existing application, foreseeing the potential impact of its removal. A proactive analysis for a seamless transition to a new user experience.
60%
K-VALUE ensures clear and visual presentation of all data, facilitating easy interpretation. The interface avoids overwhelming users with detailed information, highlighting the essential at a glance.
50%
K-VALUE provides real-time presentation of key indicators to inform expected ROI in the context of change management or digital adoption projects.